Introduction to the Battle of Earbuds
In recent years, true wireless earbuds have surged in popularity, transforming how consumers experience audio. As many seek convenience without sacrificing sound quality, brands such as Apple and Bose have emerged as leaders in this competitive market. These companies have established rigorous standards, continually innovating their offerings to meet the diverse needs of audio enthusiasts and casual listeners alike. This blog post focuses on two exemplary products: the AirPods Pro 2 and the Bose QuietComfort Ultra Earbuds 2.
When selecting top-tier earbuds, consumers typically prioritize several crucial aspects, including sound performance, noise cancellation capabilities, comfort, battery life, and additional features that enhance the overall listening experience. Both the AirPods Pro 2 and Bose QuietComfort Ultra Earbuds 2 have garnered attention for their impressive specifications, which aim to address these factors effectively. Apple’s AirPods Pro 2 are renowned for their seamless integration with other Apple devices, intelligent noise cancellation technology, and a design that prioritizes comfort, making them a favorite among loyal Apple users. On the other hand, Bose has built its reputation on delivering superior noise cancellation and top-notch sound quality, which make the QuietComfort Ultra Earbuds 2 a formidable competitor in this high-stakes arena.
This introduction serves to contextualize the contest between these two prominent earbud models. As we delve into an in-depth comparison, we will examine their distinct features, performance metrics, and overall user experience, providing an objective evaluation to help consumers make informed purchasing decisions. Ultimately, the outcome of this comparison aims to provide clarity for those navigating the increasingly complex landscape of true wireless earbuds.
Design and Comfort: Aesthetic Appeal and Fit
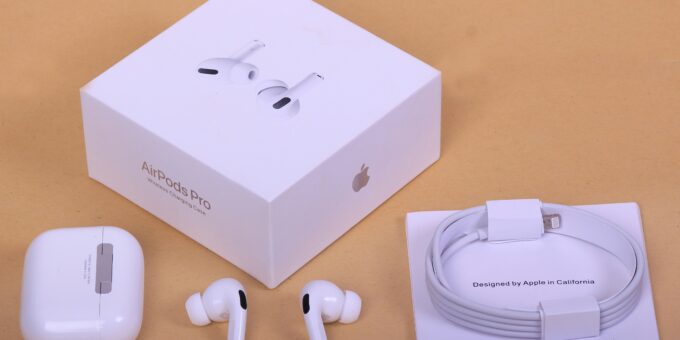
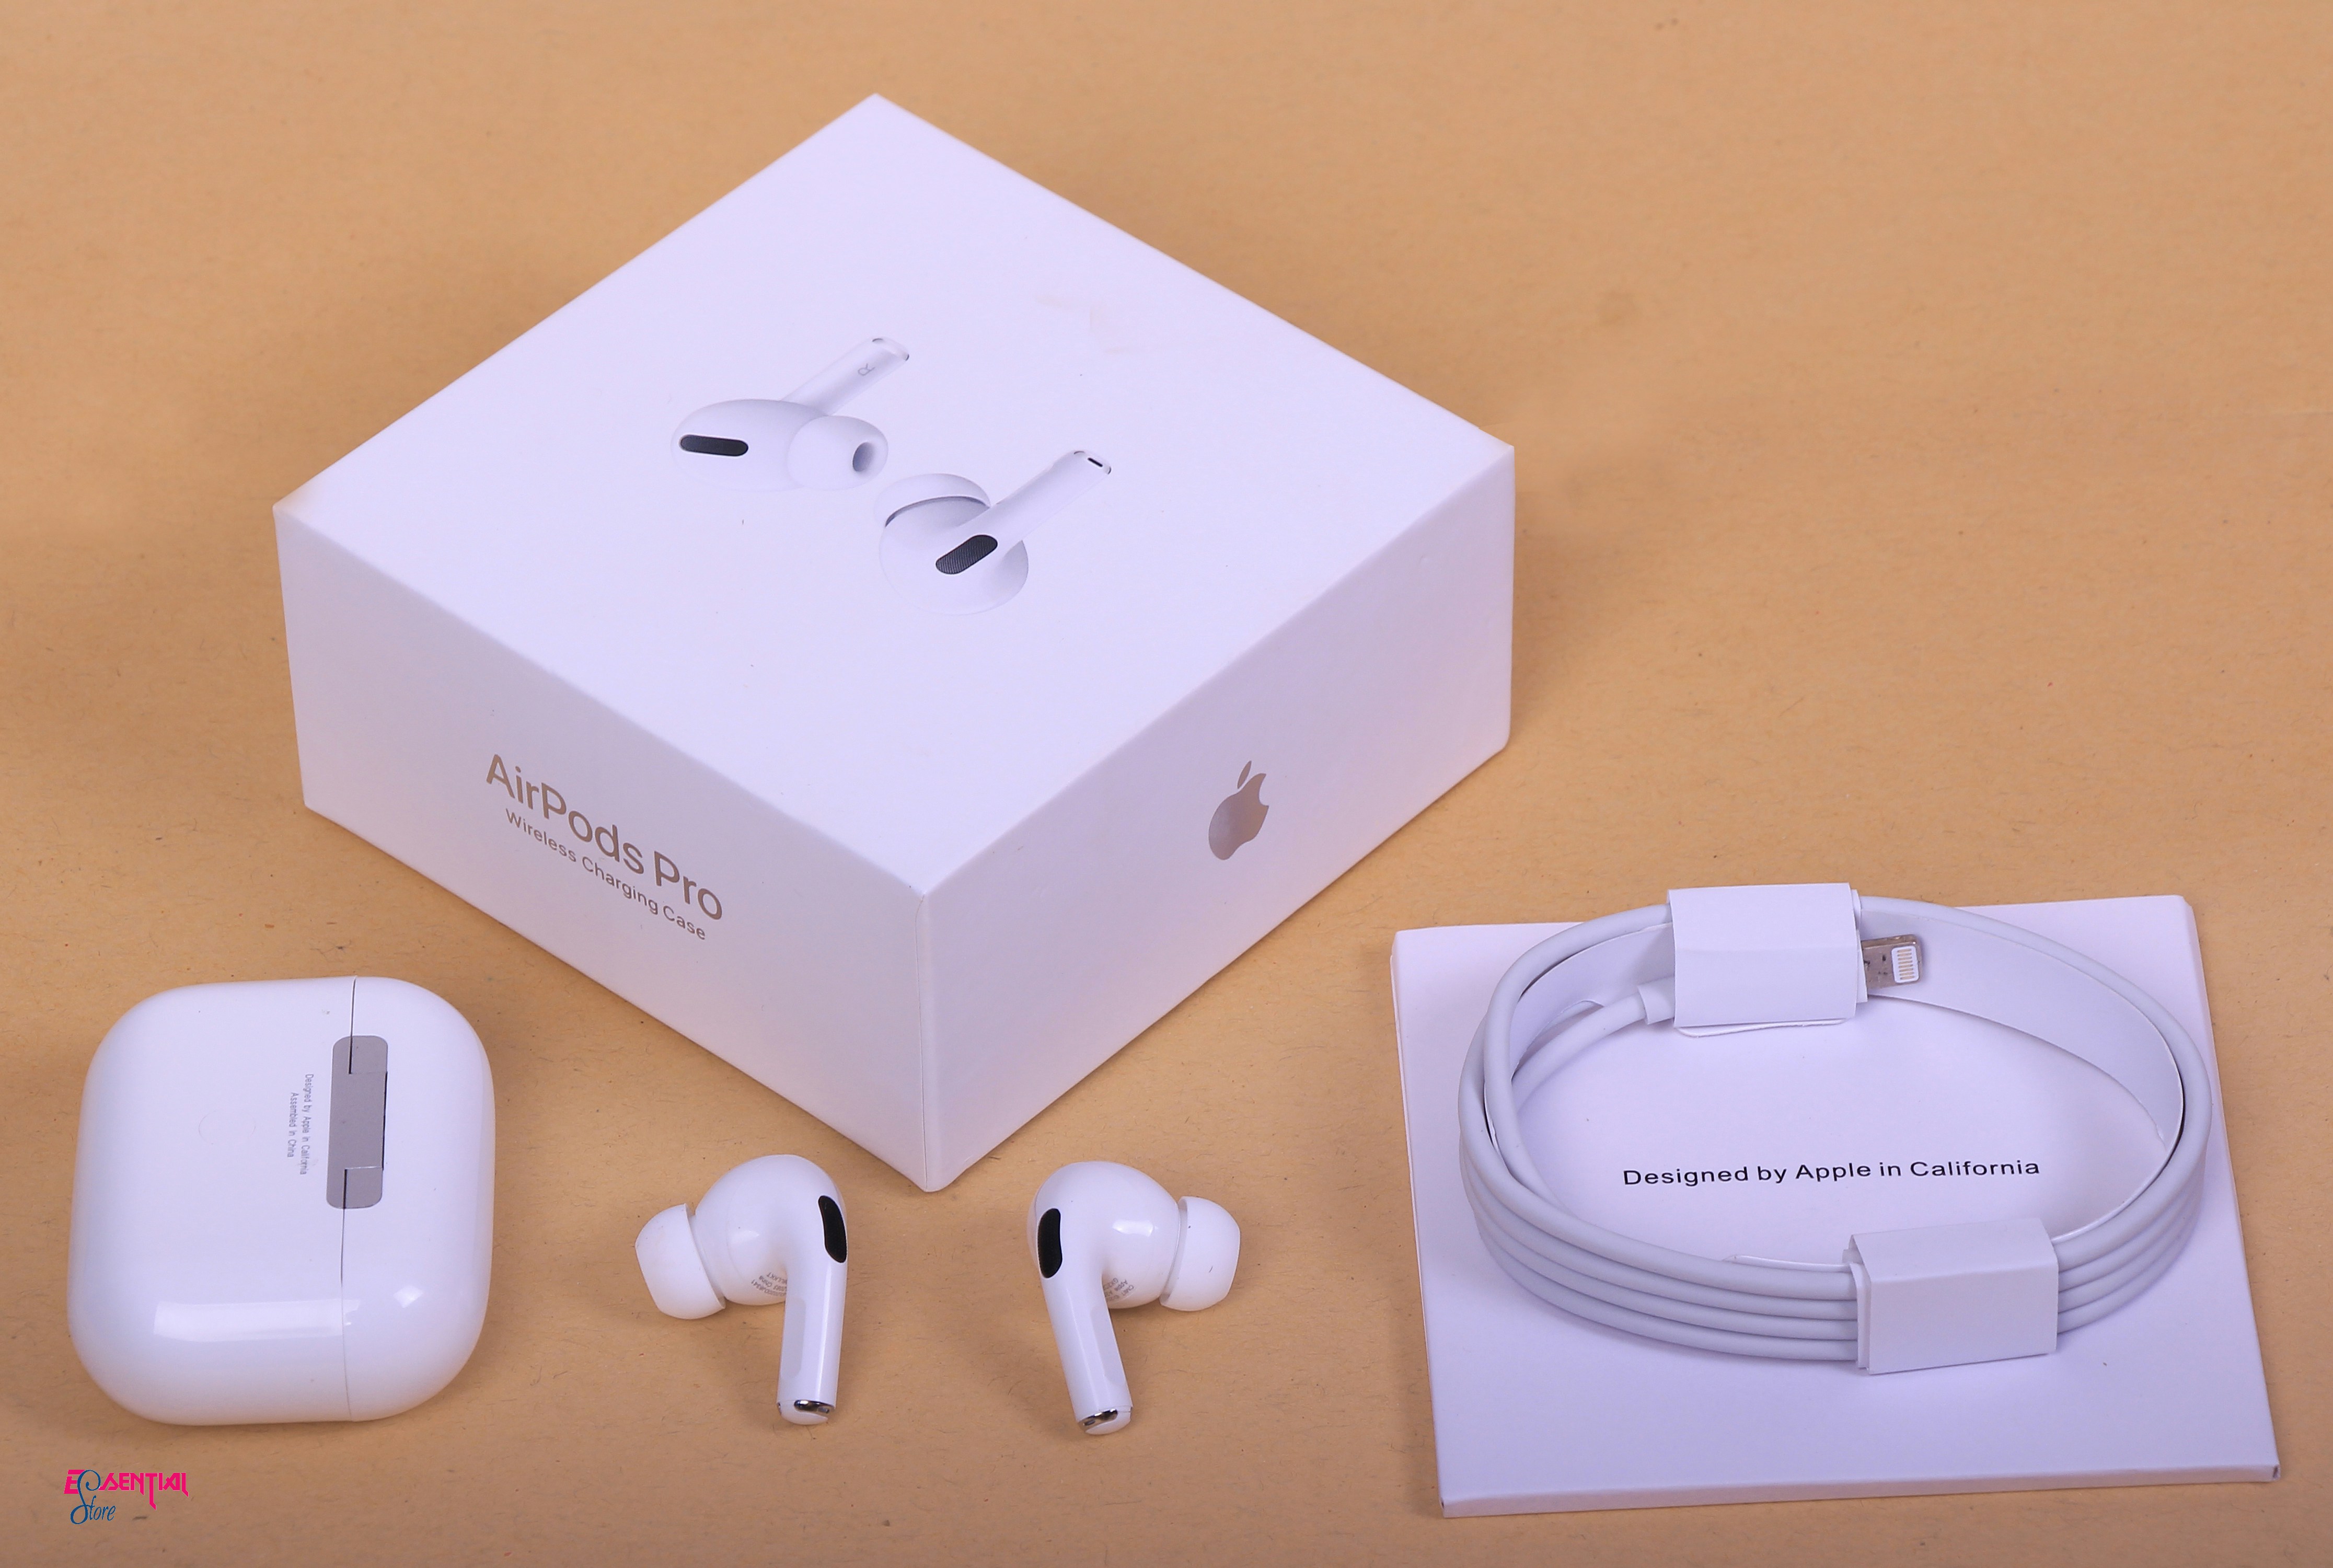
The design and comfort of wireless earbuds are crucial factors influencing user satisfaction, and both the AirPods Pro 2 and Bose QuietComfort Ultra Earbuds 2 have made significant strides in these areas. The AirPods Pro 2 showcases a sleek, minimalist design that is characteristic of Apple’s aesthetic. They feature a glossy white finish and are made from a high-quality plastic material, which contributes to their lightweight feel. The earbuds are equipped with silicone ear tips in multiple sizes, allowing users to find a comfortable fit for prolonged listening sessions. Their compact appearance is not only visually appealing but also practical, as they seamlessly integrate into various lifestyles.
On the other hand, the Bose QuietComfort Ultra Earbuds 2 emphasize a different visual and tactile experience. With a more robust design, they are available in a range of color options, including black and silver. Bose prioritizes comfort by employing soft-touch materials that enhance the overall tactile experience. These earbuds also utilize proprietary StayHear Max tips, which are designed to conform snugly to the contours of the ear, ensuring a secure fit even during extended wear. This feature is particularly beneficial for users seeking to use their earbuds for long periods without experiencing discomfort.
When it comes to ergonomic design, both models excel but cater to different preferences. The AirPods Pro 2 tends to be lighter on the ear, making them suitable for casual wear, while the Bose buds provide a more enveloping fit, which might appeal to audiophiles who prioritize sound isolation. The design philosophies of Apple and Bose are evident in their products: Apple leans towards a seamless, modern aesthetic, while Bose emphasizes functionality paired with comfort. Ultimately, choosing between these two models will likely come down to personal preferences regarding style, comfort, and suitability for long-term use.
Sound Quality and Performance: An Audio Experience Comparison
When evaluating the sound quality and performance of the AirPods Pro 2 and Bose QuietComfort Ultra Earbuds 2, it is essential to consider various aspects that define the overall audio experience. Both models have made significant advancements in terms of technology and design, resulting in a comprehensive listening experience that caters to both audiophiles and casual users.
The AirPods Pro 2 are renowned for their Active Noise Cancellation (ANC) capabilities, which allow users to immerse themselves in their audio without distractions from the surrounding environment. This feature produces a significant reduction in ambient noise, enhancing the listening experience across various genres, from classical to modern pop. Furthermore, their adaptive EQ fine-tunes the music based on the shape of the user’s ear, ensuring that the audio delivery is tailored for optimal clarity and depth.
Conversely, the Bose QuietComfort Ultra Earbuds 2 excels in delivering superior sound isolation, augmented by its robust noise cancellation systems. This model is particularly effective for bass-heavy tracks, providing a rich and resonant sound profile that can make any song come alive. The active EQ technology within the Bose earbuds ensures that music sounds balanced at any volume, allowing listeners to enjoy the full spectrum of audio without distortion.
In terms of clariy, both products perform admirably, though their respective sound signatures differ. The AirPods Pro 2 offers a brighter, more detailed sound that may appeal to those who prefer higher frequencies, while the Bose earbuds present a warmer tone with a focus on smooth bass response. After extensive comparative listening sessions, it becomes evident that personal preference plays a crucial role in selecting between these two exemplary earbud models. Ultimately, users looking for versatility may find the AirPods Pro 2 suitable, whereas hardcore bass enthusiasts might lean towards the Bose QuietComfort Ultra Earbuds 2.
Battery Life and Smart Features: Practicality and Technology
The battery life of wireless earbuds is a crucial aspect for users seeking convenience and reliability. The AirPods Pro 2 deliver an impressive listening time, offering up to six hours on a single charge. However, the included charging case extends this duration to a remarkable 30 hours, ensuring that users can enjoy extended periods of usage without interruption. Additionally, the quick charge feature of the AirPods Pro 2 provides approximately one hour of listening time with just a five-minute charge, making them particularly beneficial for those on the go.
In contrast, the Bose QuietComfort Ultra Earbuds 2 present users with a slightly different experience. A single charge allows for around seven hours of continuous playtime, which surpasses the AirPods Pro 2 in this regard. The charging case associated with the Bose earbuds further enhances usability, offering a total of up to 28 hours of battery life. This ensures users can stay connected without having to frequently seek a power source. Quick charging capabilities are also available, giving users about 15% of their battery life back in just a 15-minute charge, adding an extra layer of convenience.
When analyzing smart features, both models boast impressive technology tailored for modern-day users. The AirPods Pro 2 seamlessly integrates with Siri, enabling voice commands without needing to physically interact with the device. Touch controls offer intuitive interaction, allowing users to manage playback simply with a tap. Similarly, the Bose QuietComfort Ultra Earbuds 2 comes equipped with voice assistant compatibility, enabling users to access Google Assistant or Alexa easily. Additionally, the Bose Music app allows for extensive customization options, including equalizer settings, which enhance the listening experience according to personal preferences.
In essence, both the AirPods Pro 2 and Bose QuietComfort Ultra Earbuds 2 excel in battery life and technological features, catering to different user needs while providing essential smart functionalities.